
Project — Business intelligence
Sales & Service Analytics
Sales KPIs and trends combined with customer, product, and service-activity analysis.
The challenge
Sales and service, side by side.
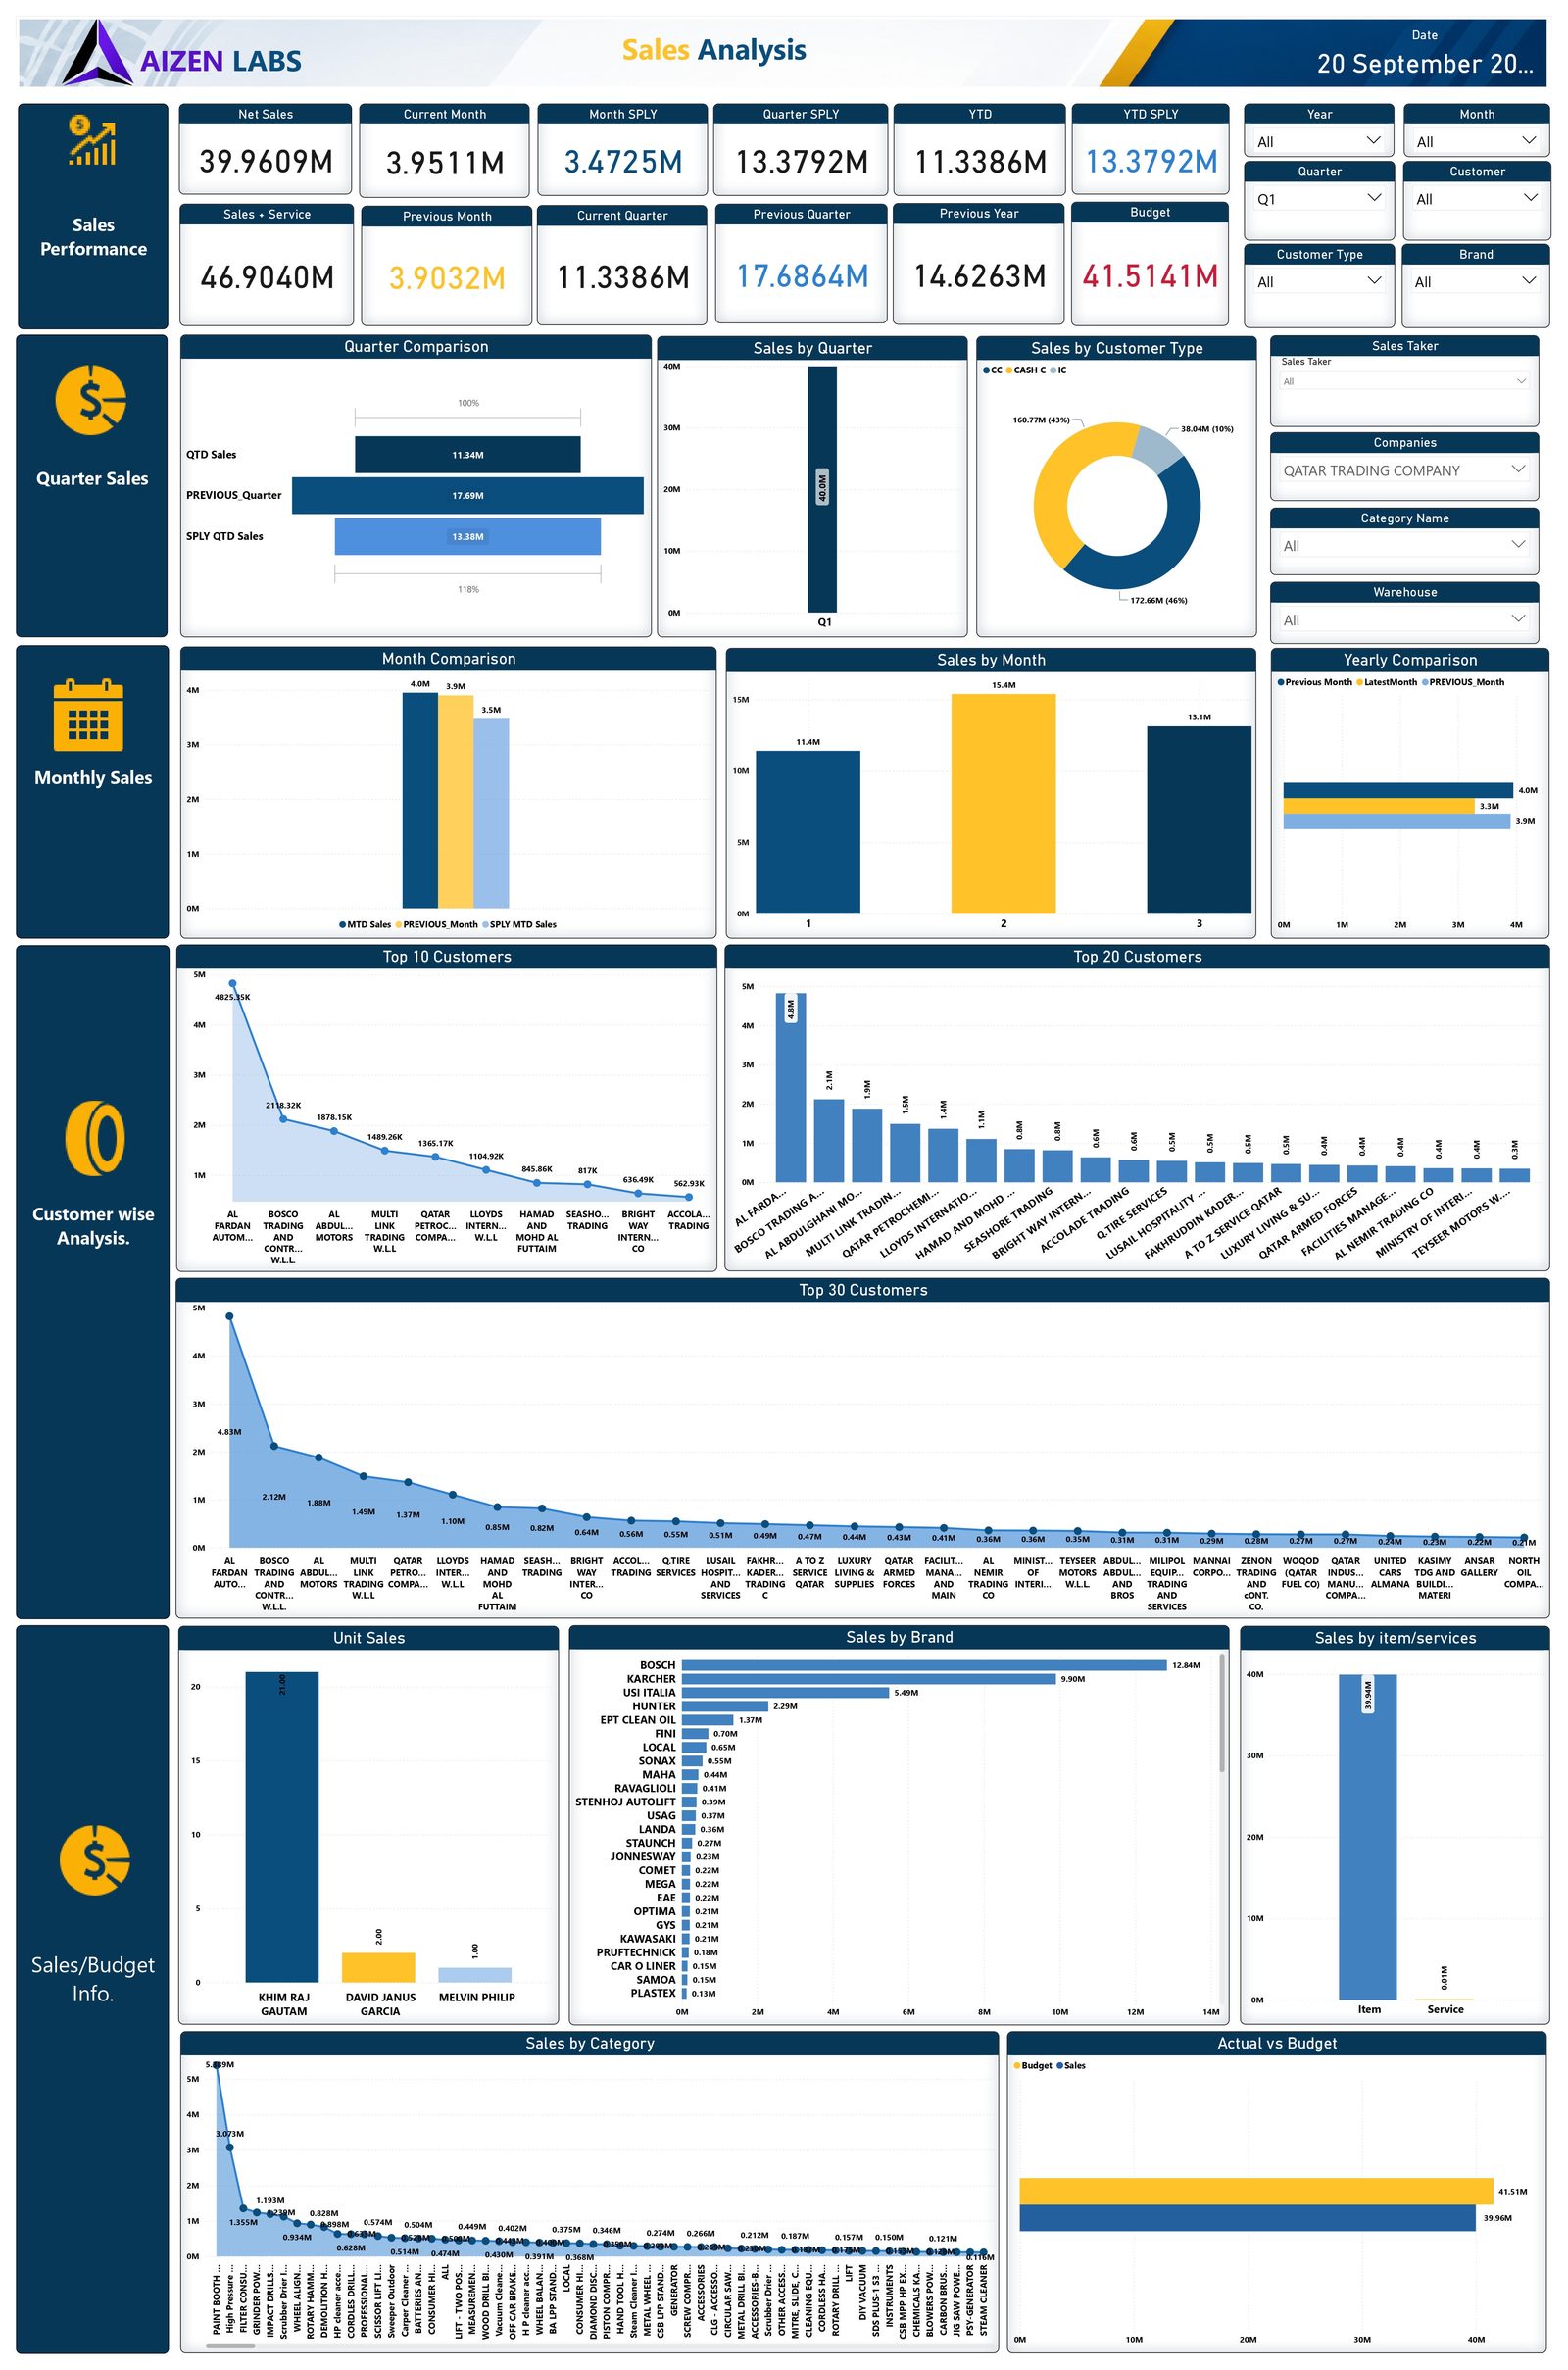
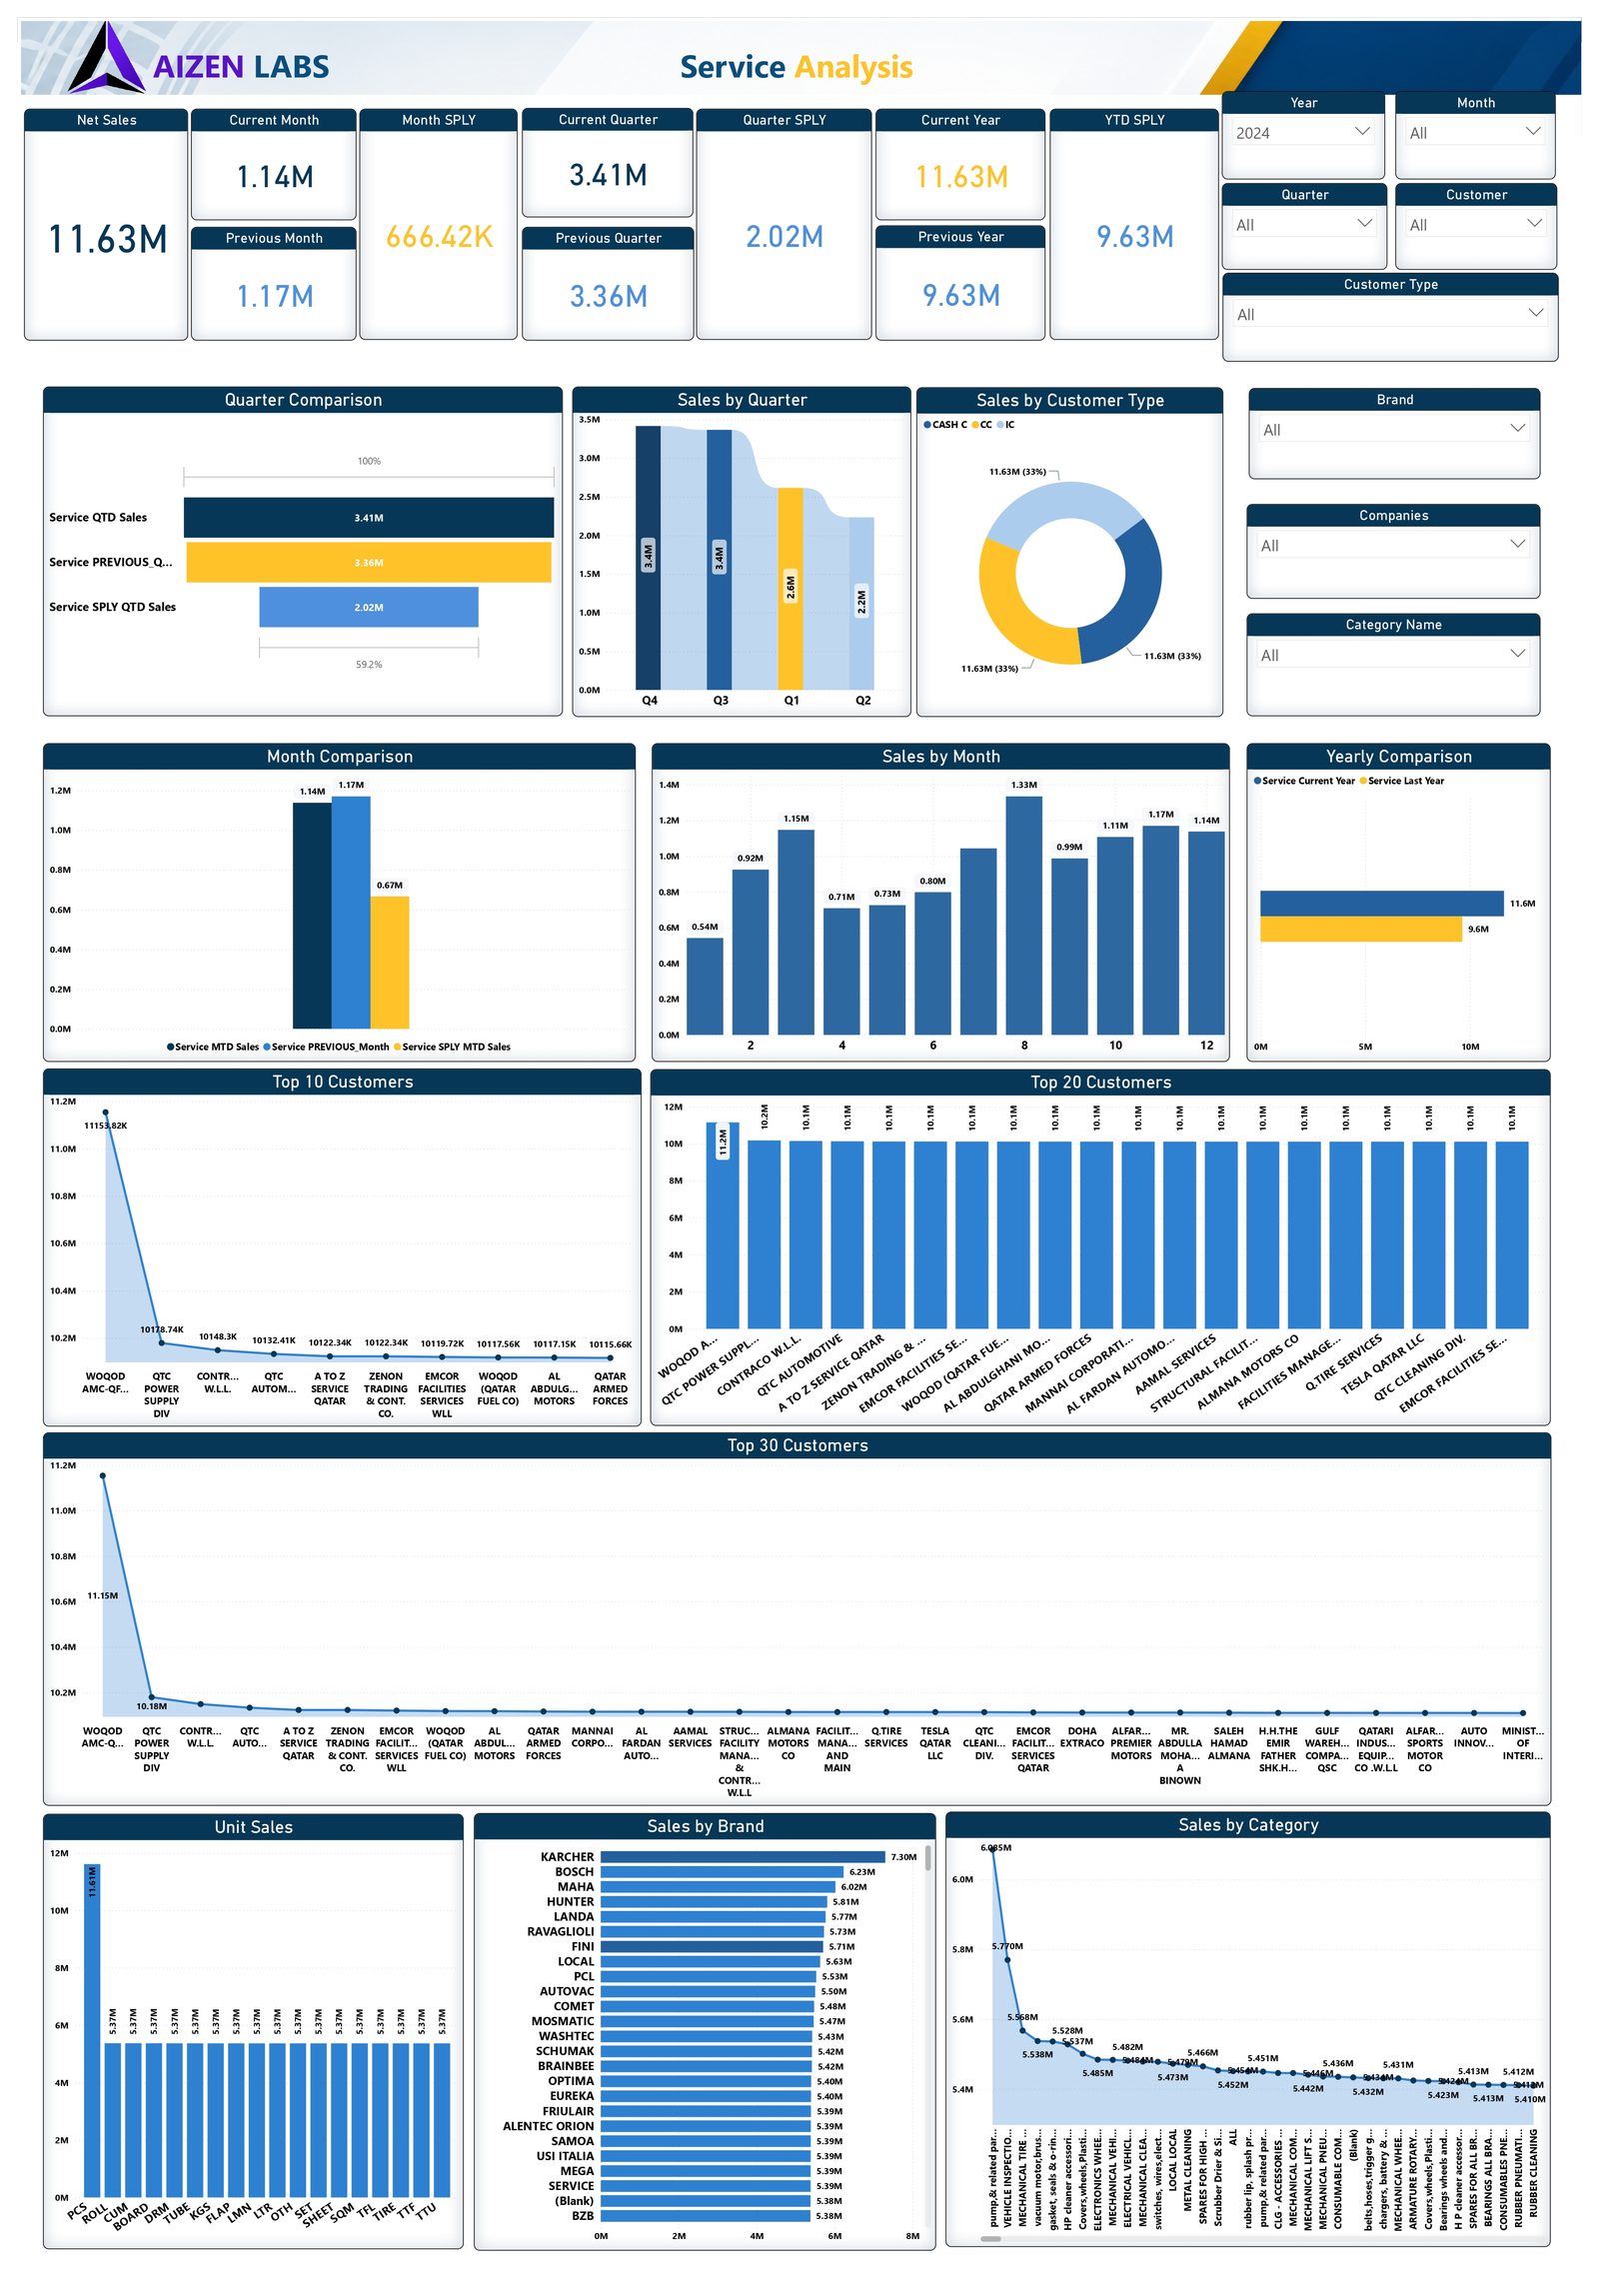
Sales and service data often live in separate views. This dashboard combines sales KPIs and trends with customer and product analysis plus service activity — performance compared and explored from one place.
What it covers
- Sales KPIs & trends
- Customer & product analysis
- Service activity
- Performance comparisons
- Interactive charts, tables & filters
What the business gets
Sales KPIs in one viewTracked consistently across the business.
Customers, products & serviceAnalysis alongside service activity.
Performance comparisonsCompared across the business.
Self-service explorationInteractive charts, tables, and filters.
Start the conversation
Need reporting like this?
Tell us about your data and the decisions it should support.