
Project — Business intelligence
Retail Footwear Sales Analytics
An interactive retail analytics dashboard for footwear sales and business performance.
The business problem
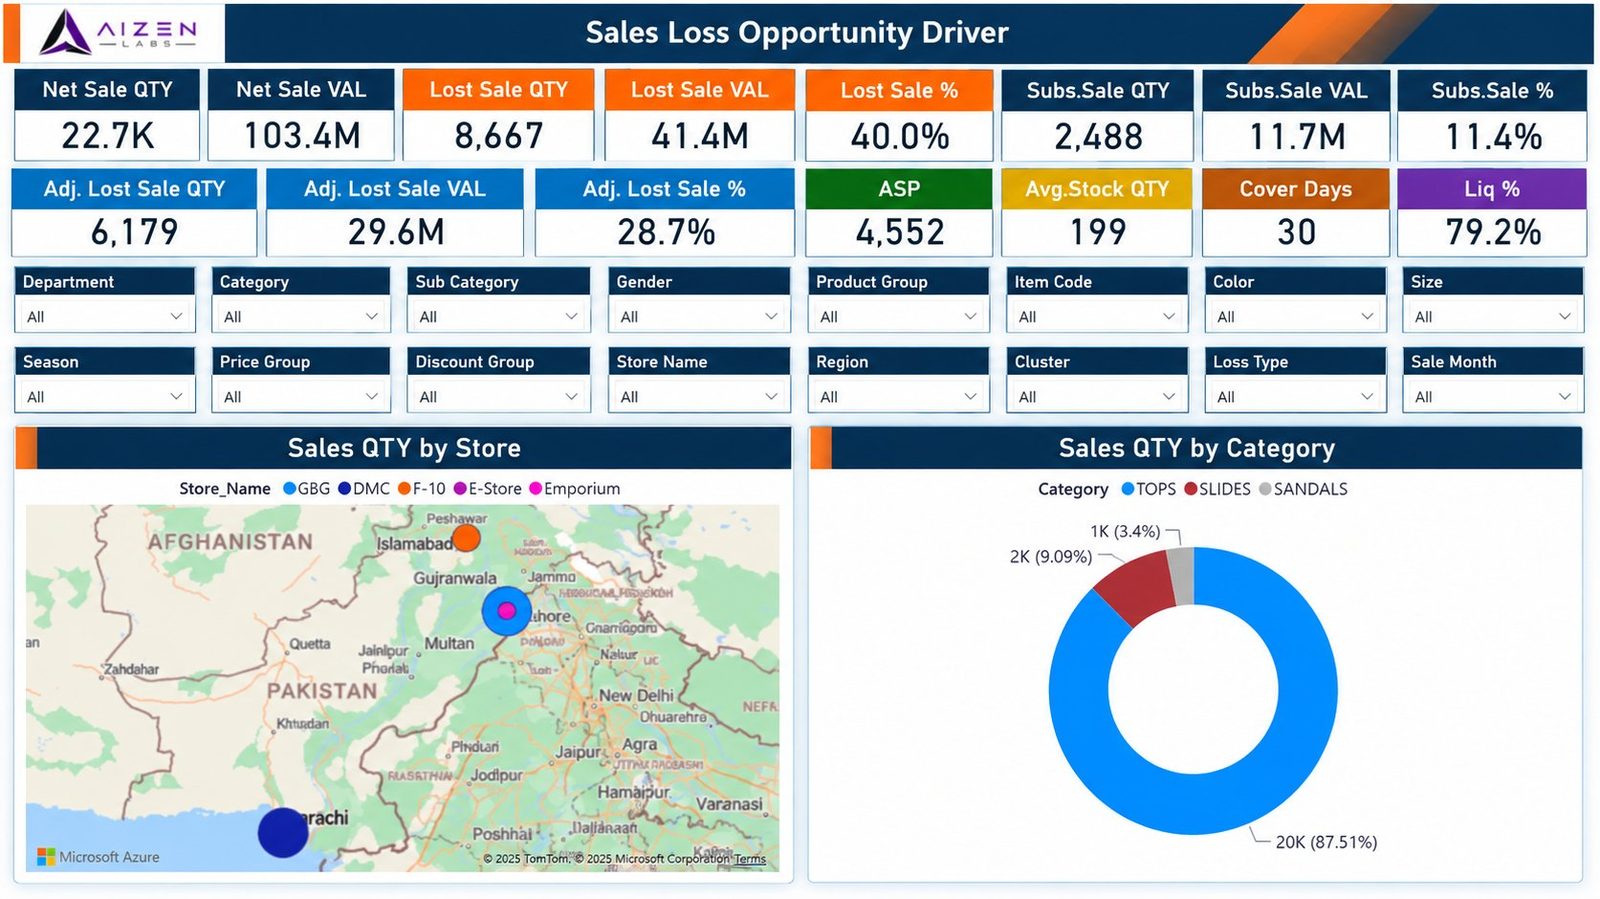
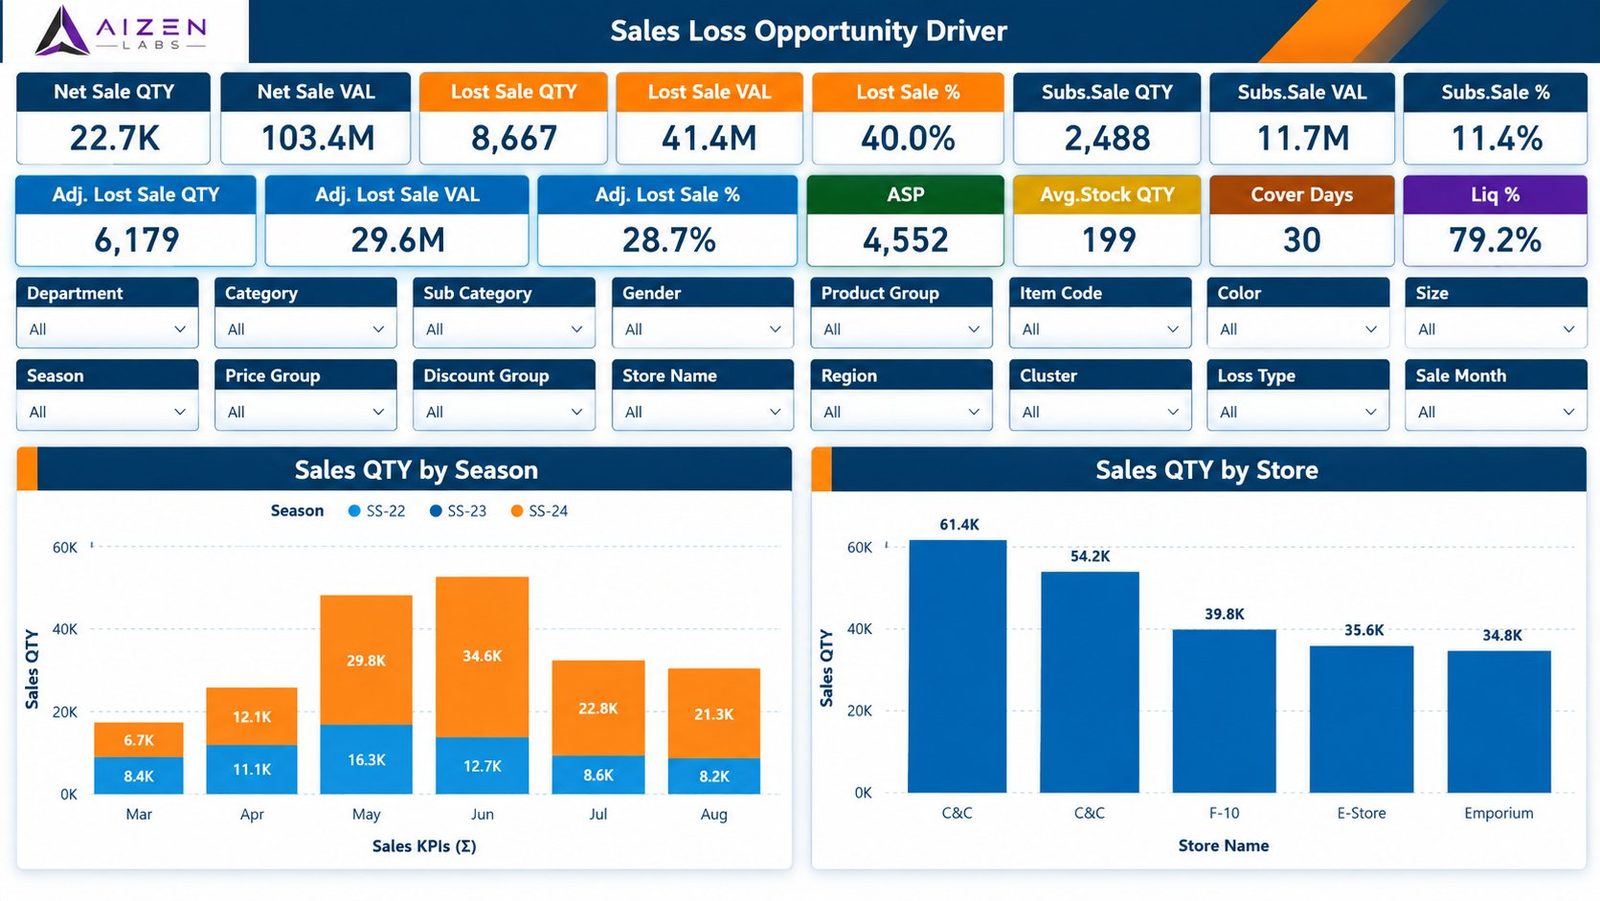
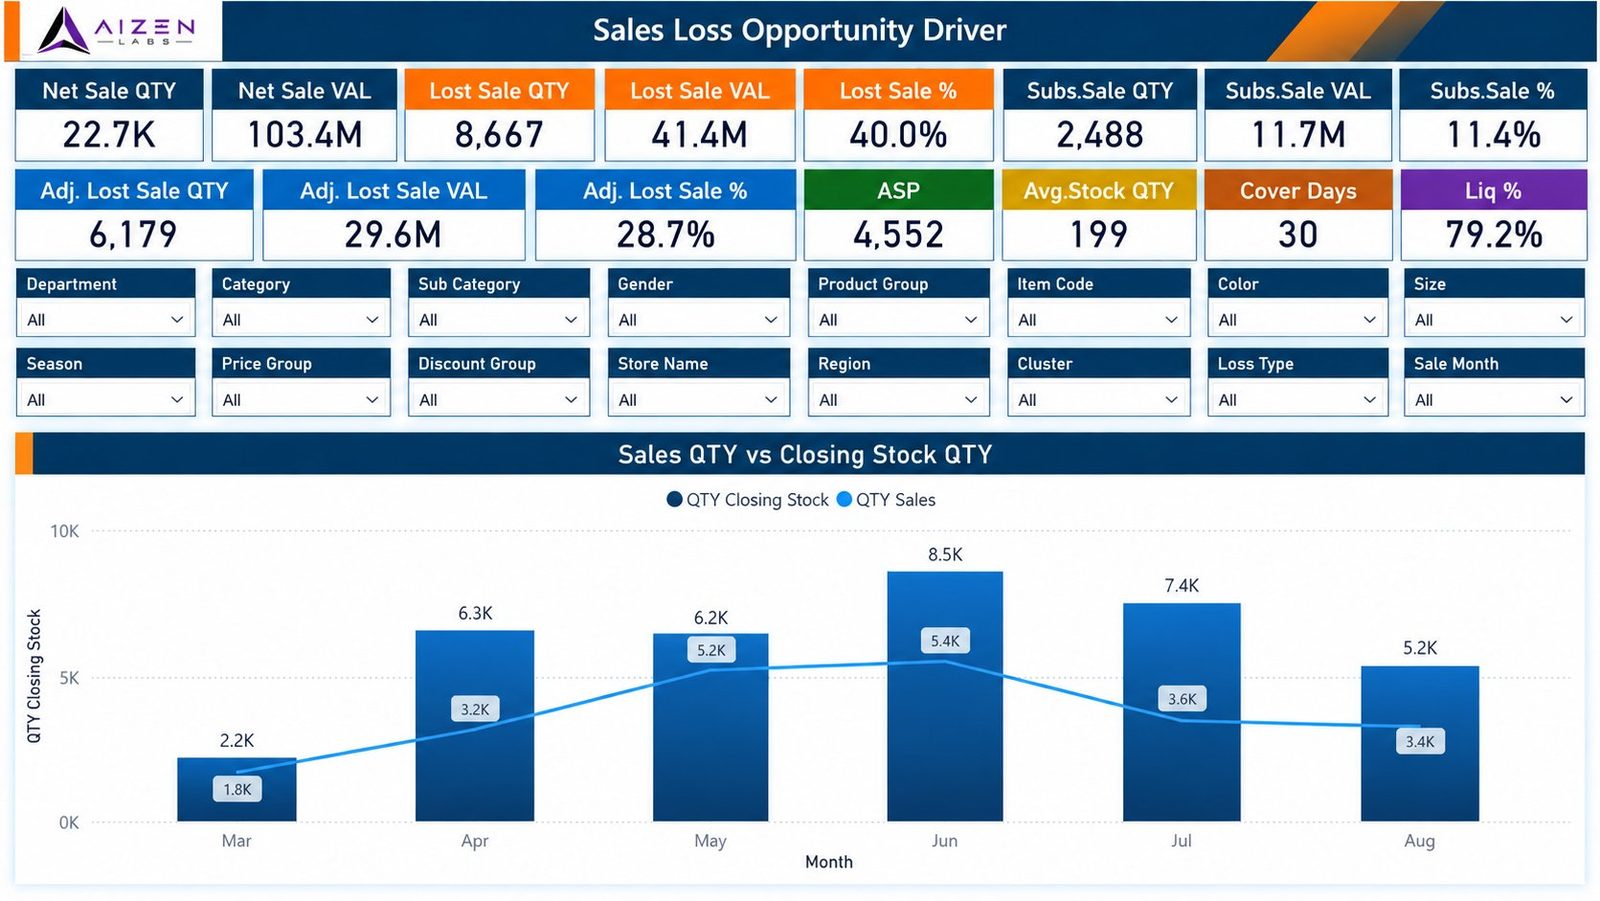
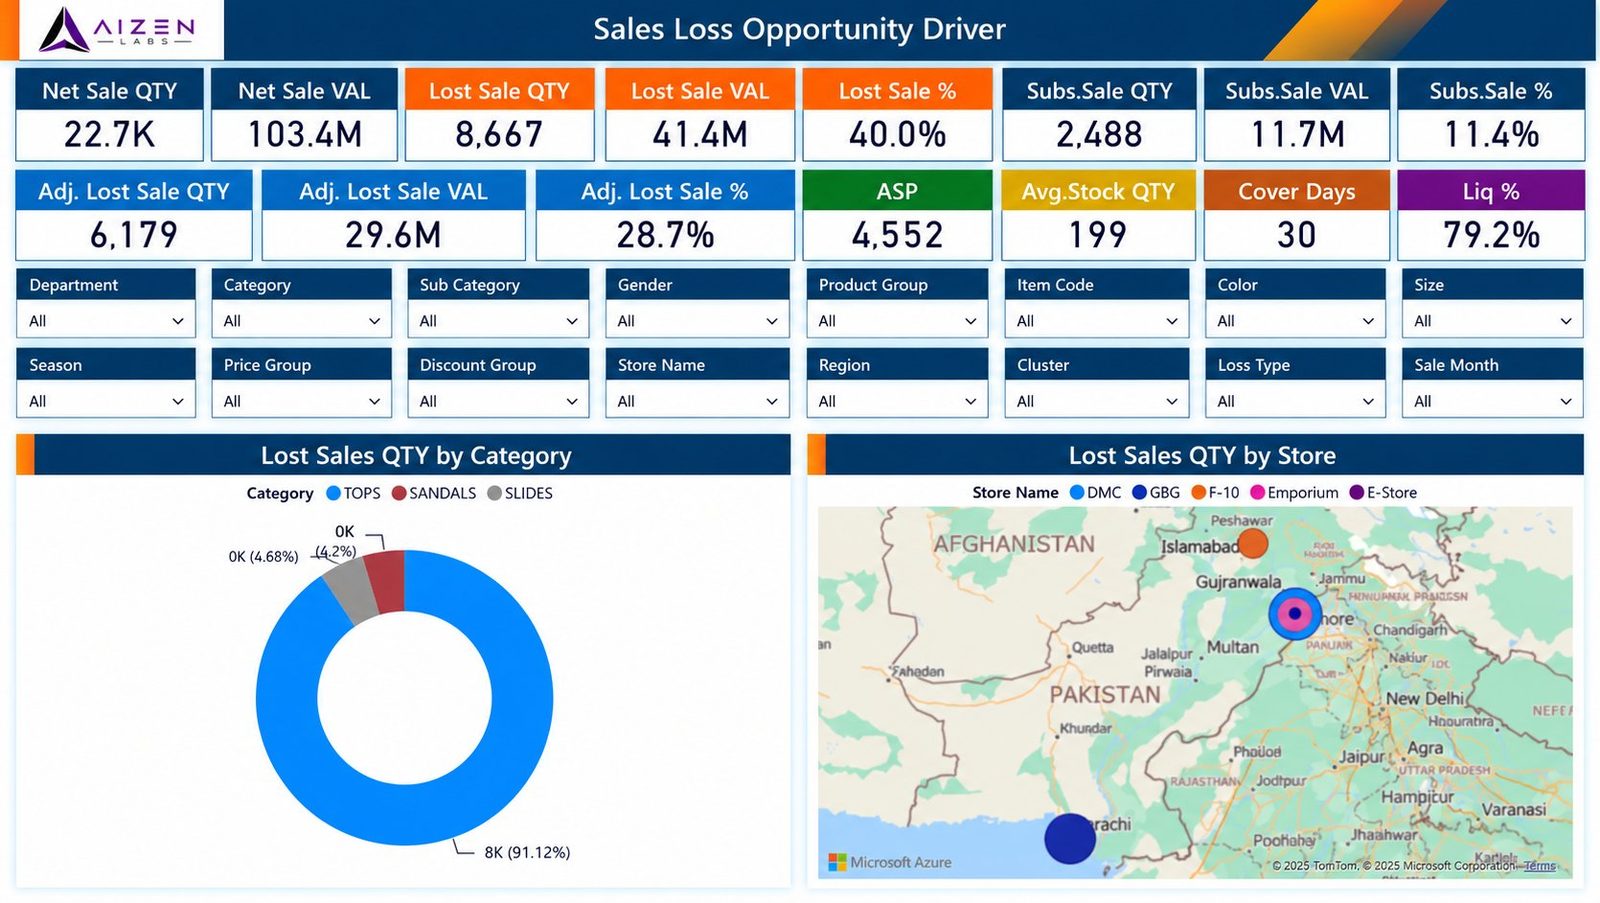
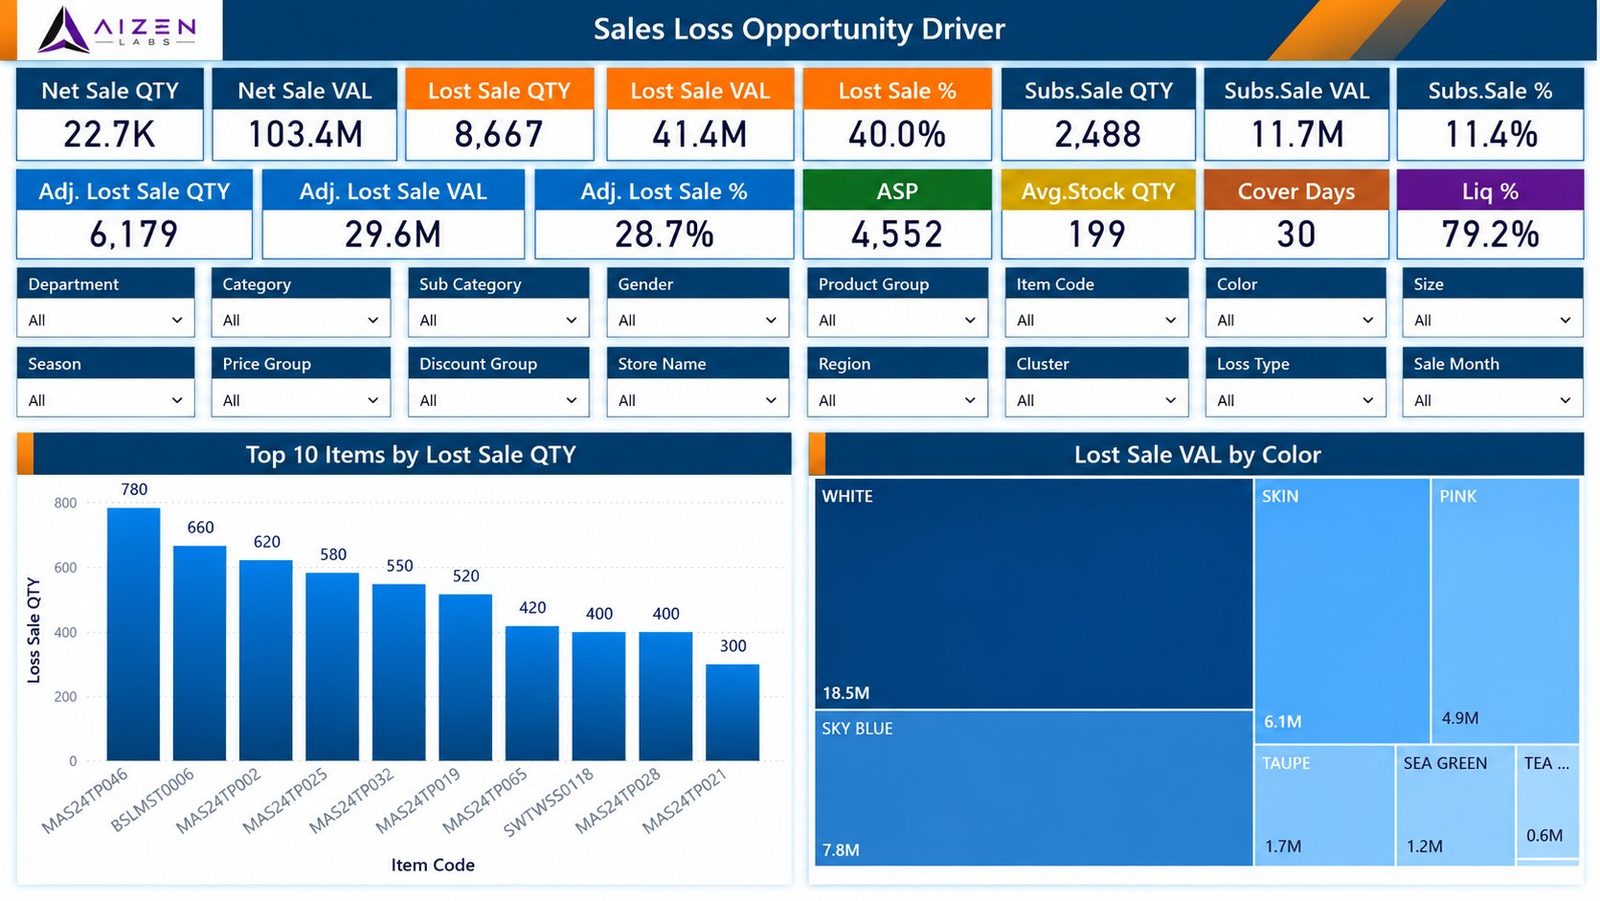
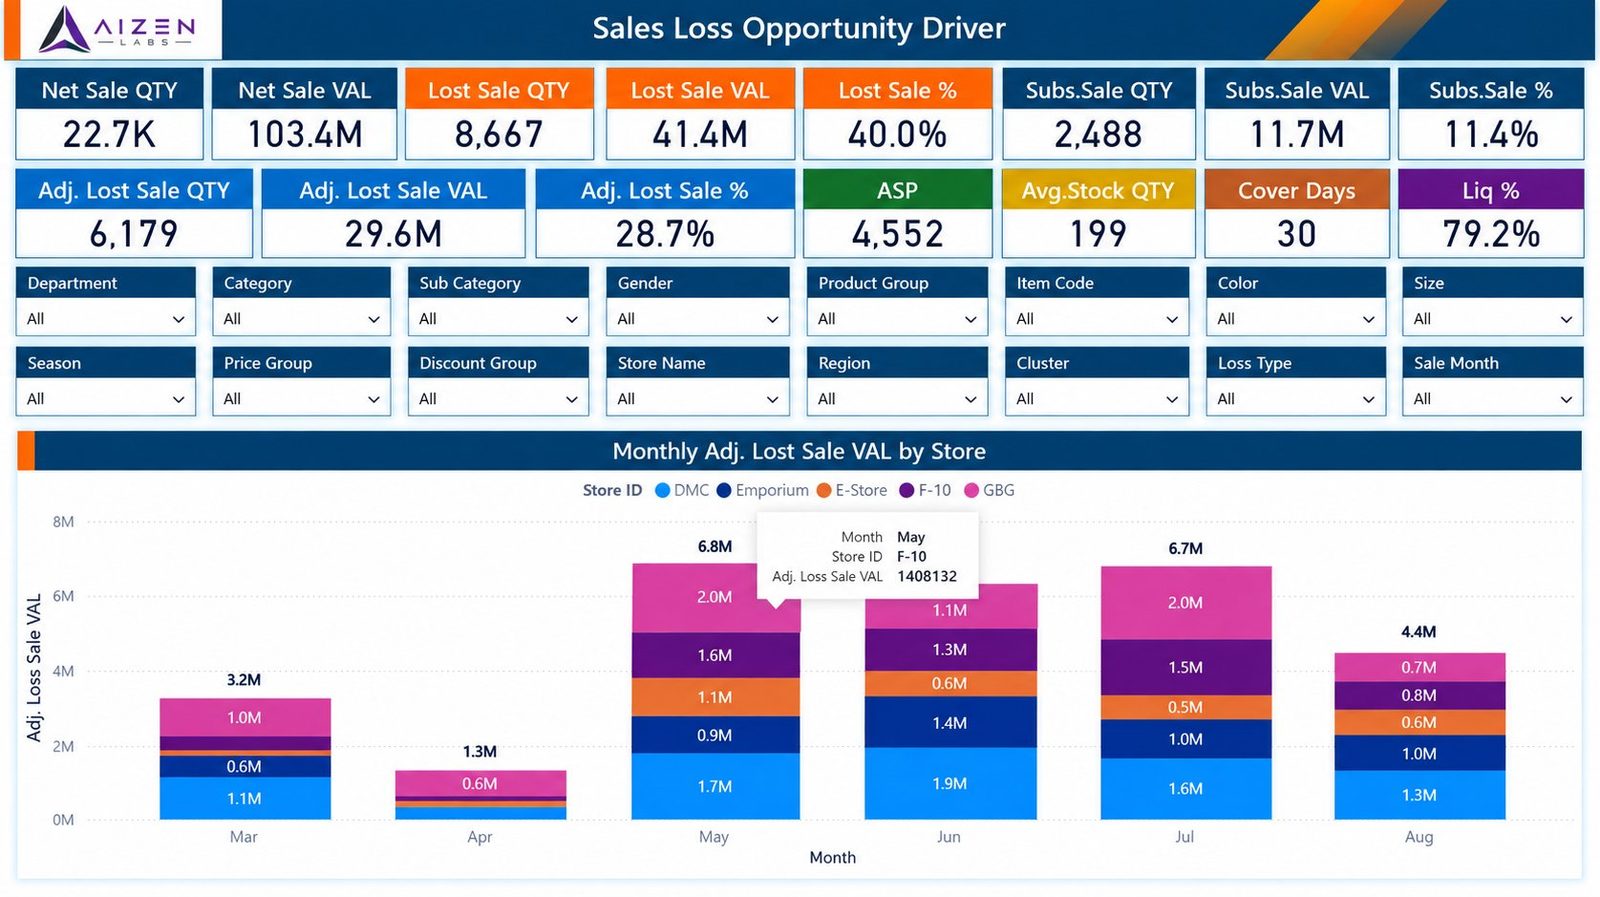
Footwear retail brings together product ranges, customer behavior, and sales trends that are hard to read from raw records alone. This dashboard was built to give the business a clearer, interactive view of how its footwear sales are performing — by product, by category, and over time.
What it covers
- Sales performance & revenue trends
- Product & category performance
- Customer analytics
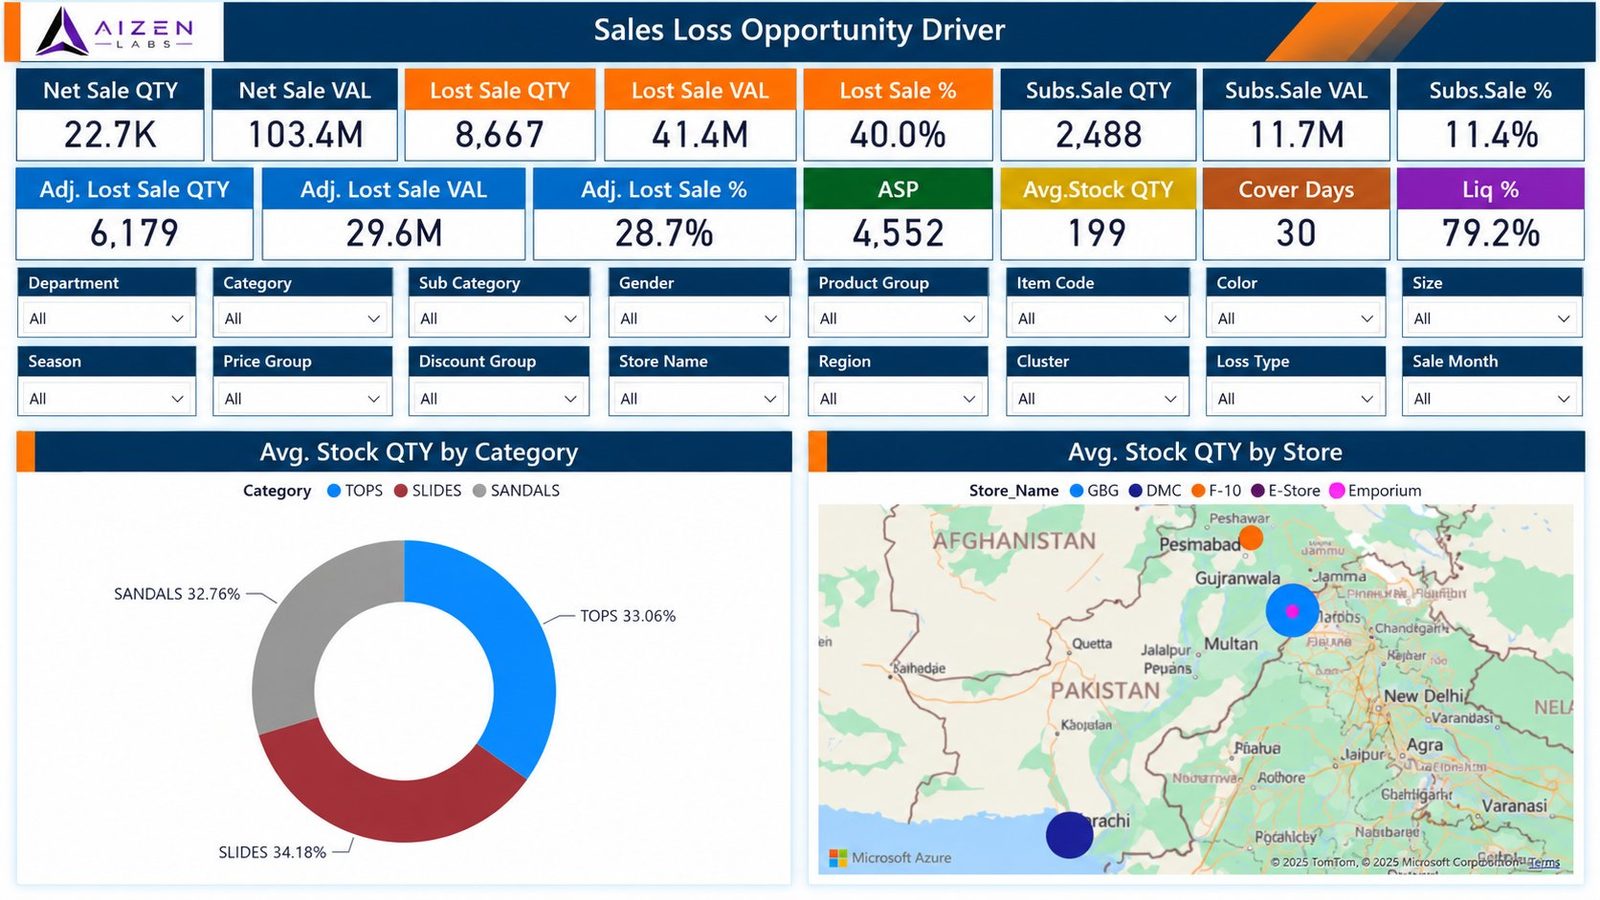
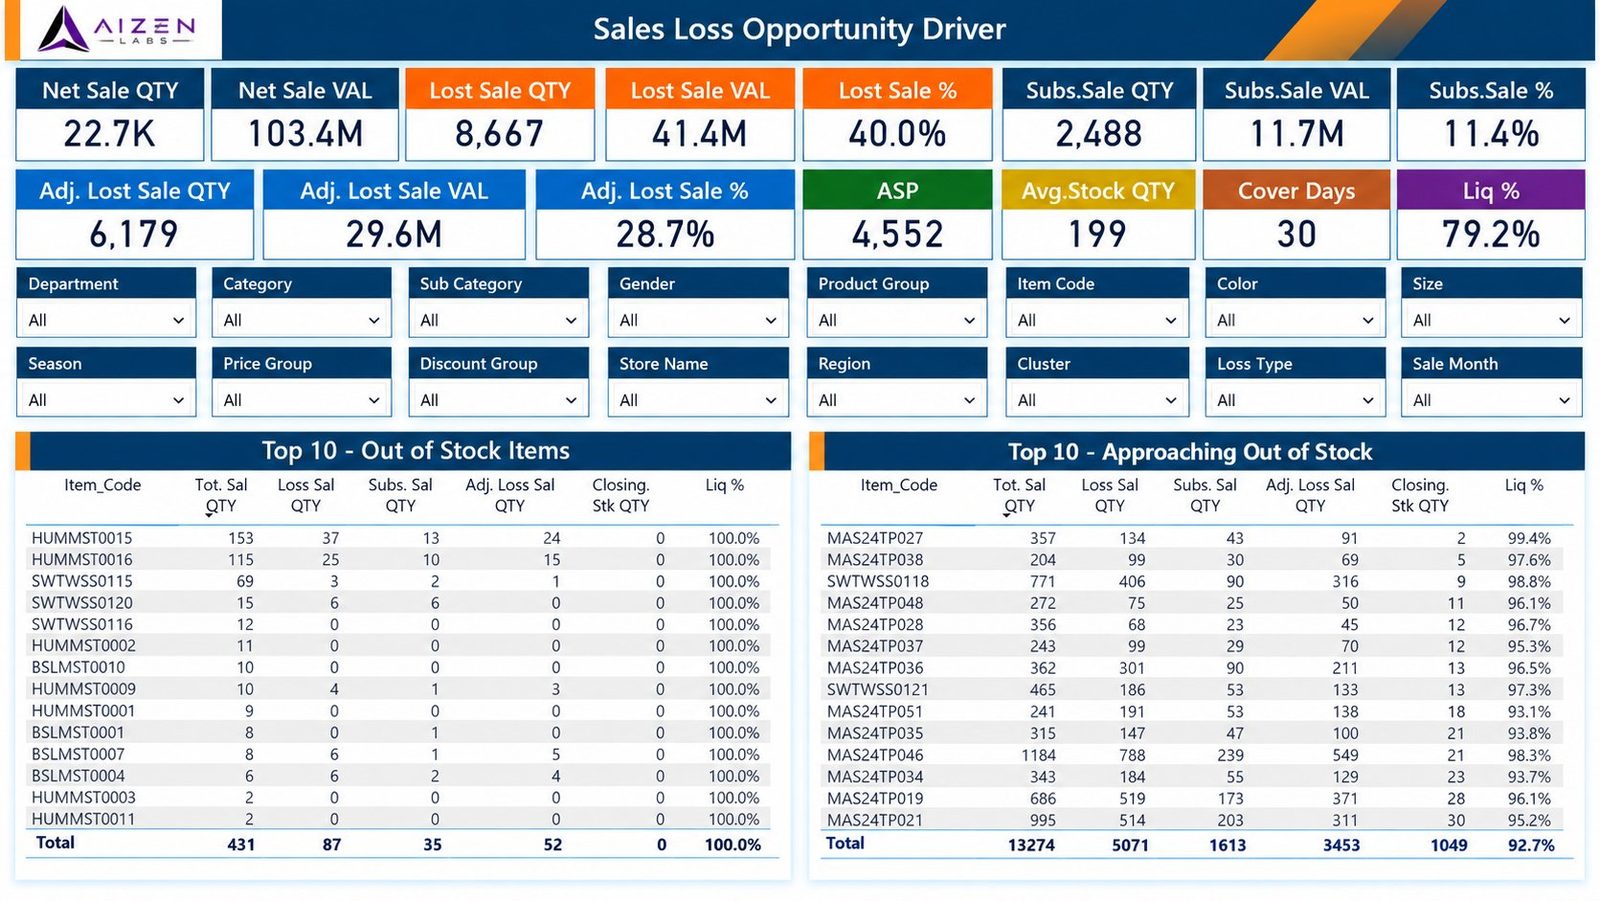
- Inventory insights
- KPI cards
- Interactive filters
- Comparisons across products and time periods
What the business gets
- A single view of sales performance and revenue trends
- Product and category performance broken down for comparison
- Customer behavior explored through interactive analysis
- Inventory insights read alongside sales for better planning
Start the conversation
Need reporting like this?
Tell us about your data and the decisions it should support.